
Excel-native reporting for Business Central means live, refreshable reports instead of exports. A plain-English guide and a one-afternoon test.
It is the second week of close, and the P&L you exported on Friday is already wrong. Accounts payable posted another batch of invoices on Monday, and now the VP of Operations wants the same P&L split by cost center. So you export again, open last month's file, paste the new figures over the old ones, and check whether the formatting survived. Somewhere in that loop the report stopped being a report and turned into a chore.
Excel-native reporting is the way out of that loop. It means the workbook holds the question rather than the answer: you define the Business Central table, companies, fields and filters once, and pressing refresh asks Business Central again and drops current figures into the same layout, leaving your formulas, pivots and formatting untouched. Anything that hands you a copy of the numbers instead is an export, however it is branded. The phrase gets used loosely enough that it helps to pin it down before you evaluate anything, so this guide explains what it means in plain terms, how it differs from the Excel options already inside Business Central, and how to tell in a single afternoon whether a tool deserves the label.
The simplest test: what happens when a new entry posts?
A report is Excel-native when the workbook holds the question instead of the answer. You define the table, the companies, the fields, and the filters once, and the workbook keeps that definition. Press refresh and it asks Business Central again, then drops the new figures into the same layout. Your formulas, pivots, and formatting stay exactly where you put them, and only the numbers move.
Everything else is a copy. A copy can be accurate on the day you make it, but it has no way of knowing what posts afterward, which is how a shared drive ends up holding four versions of the same March P&L.
What Business Central already gives you, and where each route runs out
Business Central ships with more Excel options than most teams use. Microsoft's documentation on viewing and editing in Excel covers the first two. Open in Excel sends the list you are looking at to a file, with no way to publish changes back. Edit in Excel keeps a connection through the Business Central add-in, so you can refresh the list and publish edits, which suits bulk changes such as updating credit limits across a customer list. The third route pairs a financial report with an Excel template, and Microsoft's own walkthrough shows the monthly routine: change the date filter, choose Update Copy of Existing Document, pick the template and its Data tab, then save the result under a new name so the template stays clean.
Side by side, the four routes to Business Central numbers in Excel differ mainly in what survives when you press refresh.
[[TABLE_START]]
Route | What a refresh does | What survives it | Where it runs out
Open in Excel | Nothing, the file is a static copy | Nothing, you export again | Stale at the next posting
Edit in Excel | Refreshes the list and can publish edits back | The list, not a report layout | Built for bulk list edits, not statements
Financial report plus Excel template | You run Update Copy of Existing Document and save a new file | The template, because you save under a new name | One new file per report, per month
Excel-native add-in | Re-runs the stored query against Business Central | Formulas, pivots and formatting | Reads only, no write back to the ledger
[[TABLE_END]]
None of that is wrong, and for a single statement once a month the template routine works fine. The strain arrives with the second report, then the tenth, because the first three routes each hand you a copy of the numbers. Copies go stale at the next posting, and rebuilding them becomes your job.
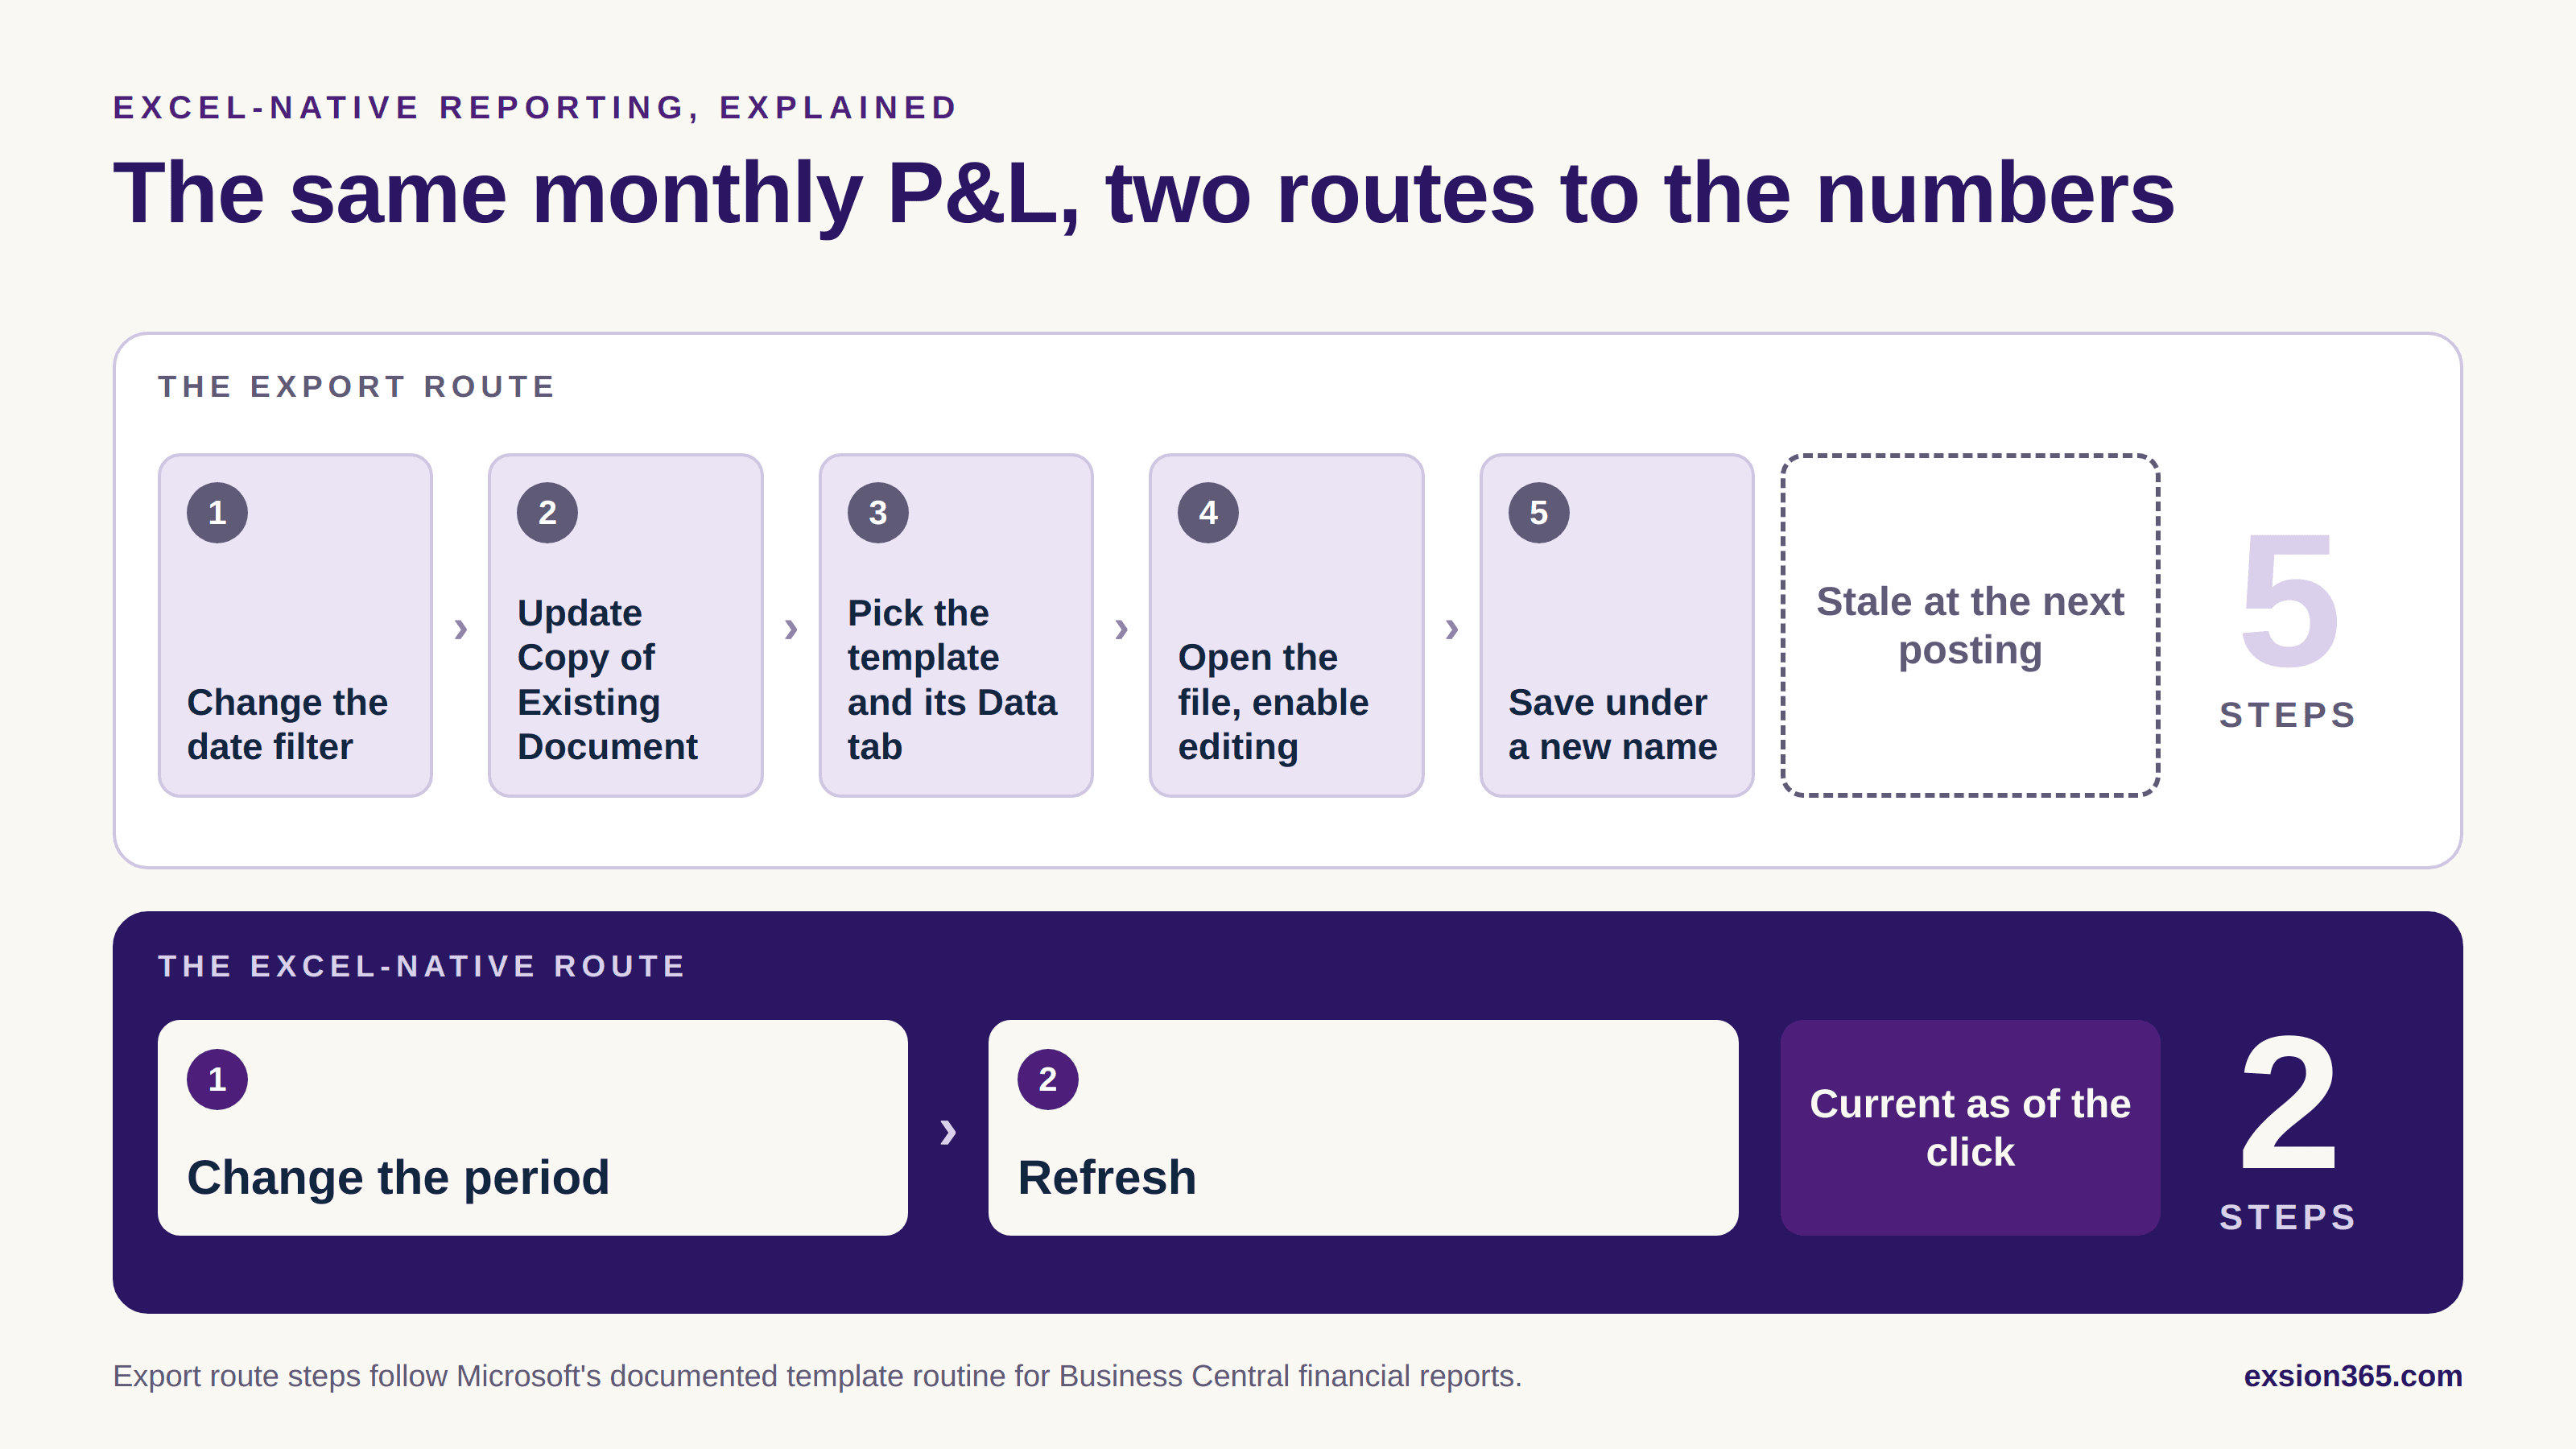
Figure: The same monthly P&L, two routes to the numbers. The export route follows Microsoft's documented template routine for Business Central financial reports.
What changes when the query lives in the workbook
With an add-in such as Exsion Reporting, the definition sits in the workbook as a readable grid showing the table, the companies, the fields, and the filters. A colleague can open your file and see exactly why a figure is what it is, which matters the day an auditor asks. Refresh runs that definition against Business Central through the API, so the controller who rebuilt the same P&L every month now changes the period and presses one button.
Three things follow from that. The first is traceability: from any number you can open Business Central filtered to the entries behind it, or double-click a pivot to see the underlying rows, and Exsion's drill-down guide walks through it step by step. The second is security. The connection signs in with your Business Central credentials, so an analyst who cannot open the payroll company in Business Central will not see it in Excel either. The third is scale, which surprises people who assume Excel gives out early. Exsion's own benchmark is 700,000 G/L Entry rows refreshed in under five seconds, and a single PivotTable can hold up to 25 million rows when the data loads straight into the data model.
Live data is not always flattering, and it is worth being direct about that. When a refresh shows a line that jumped overnight, the tool is not misbehaving; somebody posted something on Monday. Teams moving from exports to a live connection often find the report was never the real problem. The problem was that nobody could see the entries behind the numbers fast enough to ask about them.
Who ends up using it
The controller usually goes first, but the pattern that sticks is wider than that. An accounts receivable analyst who used to ask for an aging export builds her own from the customer ledger entries and refreshes it before every collections call. A plant accountant checks his cost center against budget without opening a ticket. N+P Group, which reports across 45 legal entities, has everyone from senior management to site administrators refreshing the same reports, and new colleagues work independently after a couple of sessions over a couple of days. Familiar Excel does most of the training.
Groups with more than one company get a second benefit. In Business Central every company keeps its own ledger, and the built-in route to a group view runs through a separate consolidated company that imports each business unit's data. That route suits formal consolidated statements. For day-to-day visibility, ticking the companies in the query grid returns one table with a company column, and a pivot does the rest. Which approach fits depends on whether you need eliminations or simply a live group view.
What it will not do
Excel-native reporting handles the recurring work of a finance team very well, and it is not a dashboard product. A board pack with interactive visuals that a hundred managers open on Monday morning belongs in Power BI, and our comparison of Power BI and Excel draws that line in detail. It reads from Business Central and leaves the ledger alone, so anything that must write journals or budgets back needs a different tool. And someone still has to design the layout the first time. That happens once, and then it is done.
A one-afternoon test before you commit to anything
Pick the report your team rebuilds most, connect a trial to a sandbox, and build it once. Then run three checks. Post a test entry and refresh, to see whether the number moves without you touching the layout. Change the period and confirm that pivots, formulas, and formatting survive. Finally, sign in as a user with narrower permissions and see whether they get less than you do. A tool that passes all three is Excel-native in the way that matters, and one that fails the first is an export with better branding.
The 30-day Exsion trial covers the full product, and the add-in installs from AppSource in about five minutes, so the experiment costs an afternoon rather than a project. If you want the longer treatment, the guide for CFOs and controllers picks up where this one stops. The question worth sitting with before you start is which report you would be happiest never rebuilding again.
Frequently asked questions
[[FAQ_START]]
What does Excel-native reporting actually mean? | The workbook holds the question rather than the answer. You define the Business Central table, companies, fields and filters once, and pressing refresh asks Business Central again and drops current figures into the same layout.
How is it different from Open in Excel? | Open in Excel sends the list you are looking at to a file with no way to publish changes back, so it is a copy that goes stale at the next posting. An Excel-native report keeps the query in the workbook and re-runs it.
Does it respect Business Central permissions? | Yes. The connection signs in with your Business Central credentials, so a colleague who cannot open a company in Business Central will not see it in Excel either.
How much Business Central data can Excel handle this way? | Exsion's own benchmark is 700,000 G/L Entry rows refreshed in under five seconds, and a single PivotTable can hold up to 25 million rows when the data loads straight into the data model.
Can I report across several Business Central companies at once? | Yes. Ticking the companies in the query grid returns one table with a company column, and a pivot does the rest. Formal consolidated statements with eliminations still belong in Business Central's consolidated company.
Can an Excel-native report write data back to Business Central? | No. It reads from Business Central and leaves the ledger alone, so anything that must post journals or budgets back needs a different tool.
[[FAQ_END]]
Suggested reading

Building Excel-Native Reports for Microsoft Dynamics 365 Business Central: A Guide for CFOs and Controllers

General ledger checks in Excel without the hassle

Prevent data errors at the source in Business Central

How to Drill Down to Transactions in Excel for BC in 6 Steps (2026)
How to Build BC Management Reports in Excel in 7 Steps (2026)